Google Summer of Code 2023 (GSOC2023)
FURY is a free and open source software library for scientific visualization and 3D animations. FURY contains many tools for visualizing a series of scientific data including graph and imaging data. FURY is participating in GSoC this year for the first time under the umbrella of the Python Software Foundation (PSF).
GSoC is a program that allows everyone (students, professional, academic, etc...) to learn contributing to an open-source project while receiving a fellowship from Google, and mentorship from open-source software developers. For details about this year's GSoC, please refer to this page.
Before considering becoming part of the FURY GSoC, please read about our expectations.
All participants should have basic knowledge of computer graphics, scientific computing, and development in Python. For a comprehensive introduction to these topics, please refer to these 2 books:
- Interactive Computer Graphics - 6th / 7th Edition by Edward Angel and Dave Shreiner
- Effective Computation in Physics by Katy Huff and Anthony Scopatz.
However, you should be already familiar with data analysis using Python and Numpy before applying.
Be happy to ask questions directly by choosing one of the following options:
- Subscribing to our mailing list and sending a message to fury@python.org
- Opening a discussion and Select GSOC Request
- Joining our discord community.
Potential candidates should follow all these steps before applying for the GSoC:
- Take a look at the guidelines on how to contribute to FURY.
- Go through the tutorials and examples on the website, make sure you're familiar with the library.
- Run the tests. FURY has unit tests that are at about 90% coverage (amount of lines of code tested). Make sure you know how to run them, and if you've never done Python unit tests before you might want to read up on Pytest library.
- Figure out how to run a single test! Running one test instead of all of them will speed up your workflow when you are writing your tests! (hint, it's in the contributing docs!)
- Make your first contribution to FURY !!! Making a small enhancement/bugfix/documentation fix/etc to FURY is really important! It shows your understanding of the library and your Github knowledge. The fix does not need to be related to your proposal. We have and will continue adding some beginner-friendly issues in Github. You can see some of them here
This is a requirement from the PSF; it can help you get some idea of how things would work during the GSoC.
Notice 1: More project ideas might appears Stay tuned and check regularly this page!
Notice 2: We want to provide the best mentoring to our students, only 2 or 3 of these projects will be selected. Not more!
If you have any questions or if you want to contact a mentor:
- open a new discussion with GSOC as a category.
- join our discord community and ask them to our GSOC channel.
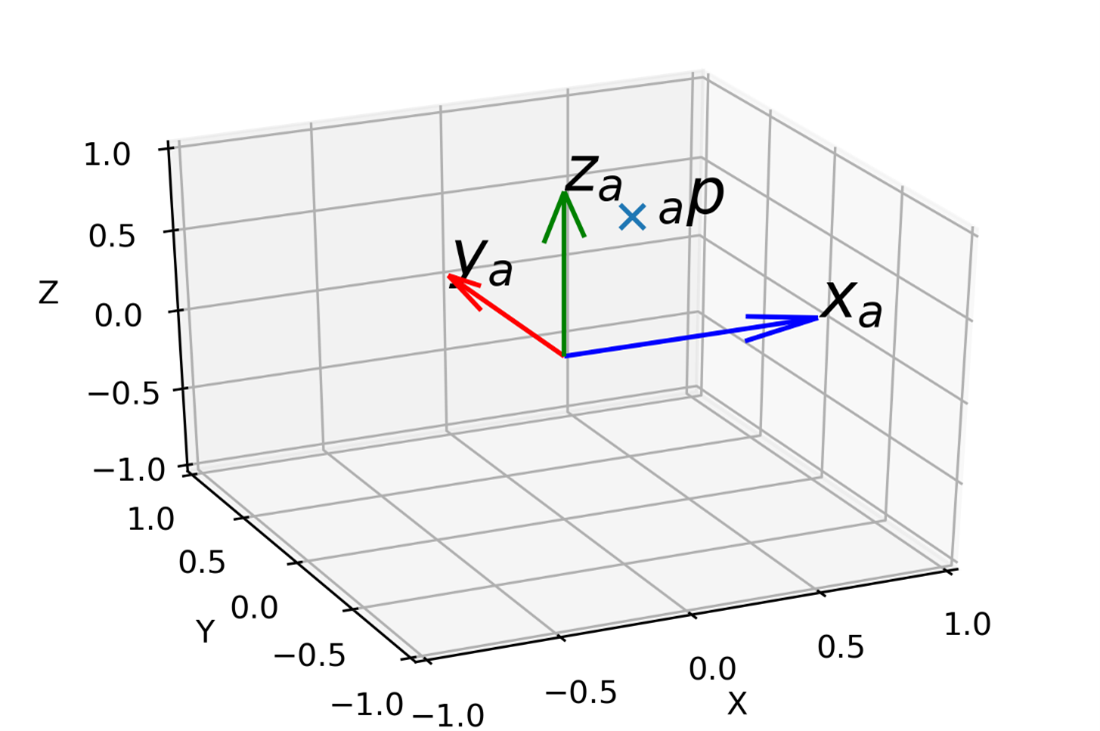
Description:
The ability to effectively display scientific data requires a correspondence between the actual and displayed scales and the use of axes to indicate such scales. Many visualization frameworks, such as d3 and Matplotlib, include a variety of ways to generate axes and frames based on the domain of the plotted data. In 3D, axes can be represented by lines or grid planes, and more work is needed to make them practical (such as displaying shadows or lines perpendicular to the grid planes). This project aims to implement a comprehensive set of actors to display dynamic scientific axes, both in 2D and 3D. This includes the development of a user-friendly API for defining ranges, linear and non-linear transformations, and customizing axes with colors, widths, labels, ticks, and more. Additionally, the project will implement high-quality 3D grids with support for shadows and orthogonal lines, as well as 2D axes, with improved heuristics for distributing labels and ticks. The axes will be animatedly through the keyframe animation API, allowing for interpolation between changes. The implementation of these features will significantly enhance the ability of FURY to produce high-quality scientific visualizations that accurately communicate data to the intended audience.
Project Steps:
- Step 1: Create the API to define ranges: linear and non-linear (log, polar, hyperbolic) transformations for axes.
- Step 2: Implement actors to display 2D and 3D axes in high quality, with support for colors, width, labels, ticks, etc.
- Step 3: Implement 3D grids supporting shadows or perpendicular lines.
- Step 4: Improve heuristics to distribute labels and ticks.
- Step 5: Add support for legends for markers and colors.
- Step 6: Improve heuristics to distribute labels and ticks.
During development, the candidate will produce tests and documentation for the resulting code and API.
Difficulty: Beginner
Dedication: Part-time (175 hours) or full-time (350 hours) project
Skills Required: Python, VTK, and FURY
Mentors: Filipi N. Silva and Serge Koudoro
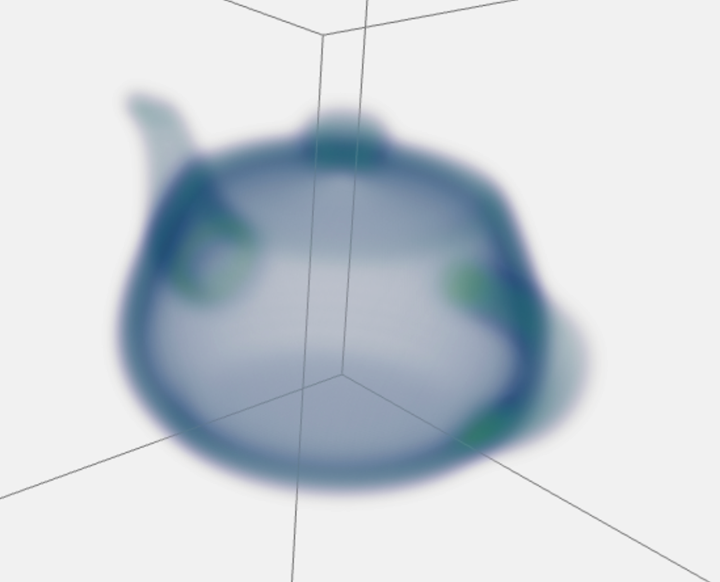
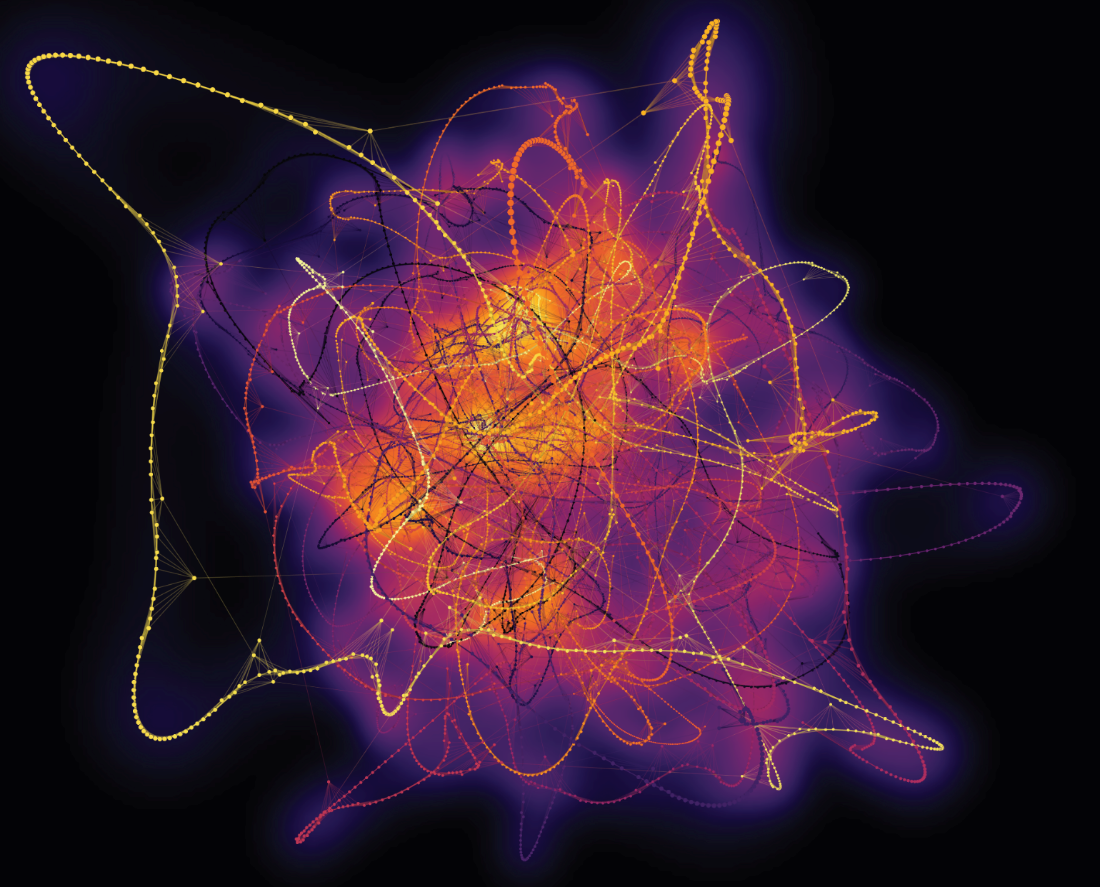
Description:
Kernel-density estimation (KDE) [1] can be helpful in scientific visualization by providing a smooth representation of large, complex data sets, such as a cloud of many points. For example, in physics, it can be used to visualize the distribution of particle positions in a simulation, allowing for the identification of clustering, voids, and other patterns that may not be immediately apparent in a traditional scatter plot. The smooth representation provided by kernel-density visualization helps to uncover essential insights in sizeable scientific data sets. This project aims to implement a real-time 2D and 3D actor for FURY to render density maps based on cloud of points. KDE can be implemented in many forms [2-6]. However, to properly support dynamic content and user interactions, rendering should be accomplished as fast as possible. Here, we propose using float framebuffers to store the density data, which can be calculated in the GPU using billboards [6]. Each billboard encodes the density pattern of a single point. These are combined via simple addition into a single float texture, which can then be mapped to a color. It would also be desirable to support surface kernels [7-9].
Project Steps:
- Step 1: Experiment and use float framebuffers in FURY.
- Step 2: Implement a simple API to deal with float framebuffers.
- Step 3: Create shaders using colormaps to render the float framebuffer.
- Step 4: Allow the composition of multiple float framebuffers.
- Step 5: Use billboards to draw density to the float framebuffers.
- Step 6 (Optional): Implement Surface Density Estimate (SDE).
During development, the candidate will produce tests and documentation for the resulting code and API.
Difficulty: Beginner
Dedication: Part-time (175 hours) or full-time (350 hours) project
Skills Required: Python, VTK, FURY, and Shading Language knowledge (GLSL)
Mentors: Filipi N. Silva and Javier Guaje
Related References and Links:
- [1] https://en.wikipedia.org/wiki/Kernel_density_estimation.
- [2] https://sites.google.com/site/dlampetest/blog/kde-in-webgl.
- [3] https://www.youtube.com/watch?v=bBuMniXbrcg.
- [4] http://ii.uib.no/vis_old/teaching/vis-project/2011-spring/lampe/index.html.
- [5] https://www.youtube.com/watch?v=bBuMniXbrcg.
- [6] https://github.com/filipinascimento/PACSExplorer/blob/782e52334a635528ec3ab4c7a4409cc88958d3ba/lib/density-gl.js.
- [7] https://ieeexplore.ieee.org/document/8525340.
- [8] https://hewenbin.github.io/sde/.
- [9] https://hewenbin.github.io/sde/javascript/examples/sde.html.
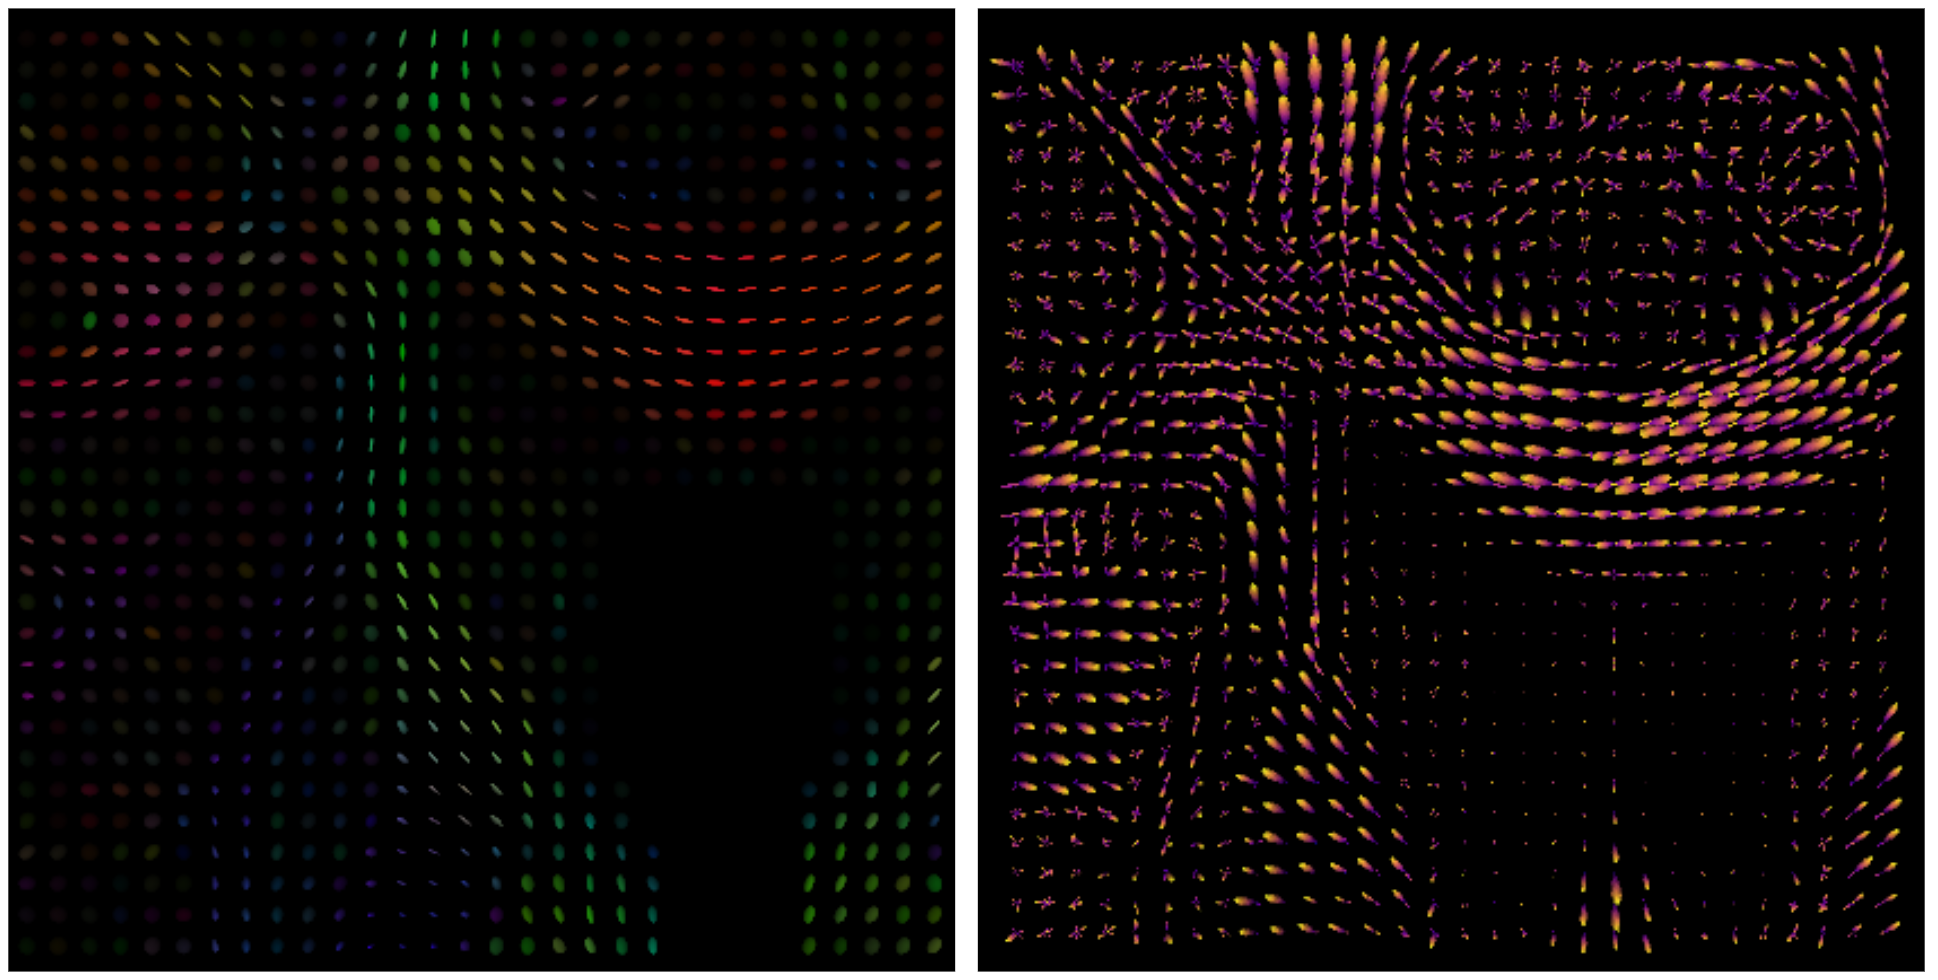
Description:
Diffusion Magnetic Resonance Imaging (dMRI) is an imaging technique that measures the diffusion of water molecules in biological tissue. This non-invasive technique is a practical way to obtain in vivo images of the brain in which many obstacles, such as axonal membranes and myelin, usually restrict the diffusion of water within the tissue. By studying changes in water diffusion, we can detect abnormalities caused by some neurological conditions, such as tumors affecting water diffusion in the disturbed area.
The technical process to get detailed voxelwise diffusion information is by capturing multiple dMRI images from different magnetic field directions and strengths. Then, depending on the acquisition criteria, either a Diffusion Tensor Imaging (DTI) [1] based model or a High Angular Resolution Diffusion Imaging (HARDI) [5] based model is used to reconstruct the directional information within each voxel. Finally, each one of these techniques is graphically represented with distinct glyphs, Tensors, and Orientation Distribution Functions (ODF), respectively.
Traditional rendering engines discretize Tensor and ODF surfaces using triangles or quadrilateral polygons. The visual quality of these elements depends on the number of polygons used to build the 3D mesh, i.e., a smoother surface will require more polygons. However, increasing the amount of rendered polygons comes at the cost of performance as it decreases the number of frames per second (FPS), which might compromise the real-time interactivity of a visualization.
This project aims to use advanced computer graphics techniques to speed up the pipeline for visualizing directional information in dMRI data. The candidate will improve the representation of several kinds of glyphs using techniques such as Geometry Amplification, Billboarding [4], Signed Distance Functions (SDFs) [3], and Ray Marching [2].
Project Steps:
- Step 1: Implement a parallelized version of computer-generated billboards using geometry shaders for amplification.
- Step 2: Model the mathematical functions that express the geometry of ellipsoids glyphs and implement them using Ray Marching techniques.
- Step 3: Model the mathematical functions that express the geometry of ODF glyphs and implement them using Ray Marching techniques.
- Step 4: Use SDF properties and techniques to represent the uncertainty of dMRI reconstruction models.
During development, the candidate will produce tests and documentation for the resulting code and API.
Difficulty: Advanced
Project Length: Full-time (350 hours) project
Skills Required: Python, VTK, FURY, and Shading Language knowledge (GLSL)
Mentors: Javier Guaje and Eleftherios Garyfallidis
Related References and Links:
- [1] Basser, P. J., Mattiello, J., & LeBihan, D. (1994). Estimation of the effective self-diffusion tensor from the NMR spin echo. Journal of Magnetic Resonance, Series B, 103(3), 247-254.
- [2] Hart, J. C., Sandin, D. J., & Kauffman, L. H. (1989, July). Ray tracing deterministic 3-D fractals. In Proceedings of the 16th annual conference on Computer graphics and interactive techniques (pp. 289-296).
- [3] Hart, J. C. (1996). Sphere tracing: A geometric method for the antialiased ray tracing of implicit surfaces. The Visual Computer, 12(10), 527-545.
- [4] Jeschke, S., Wimmer, M., & Purgathofer, W. (2005, September). Image-based representations for accelerated rendering of complex scenes. In Eurographics (State of the Art Reports) (pp. 1-20).
- [5] Tournier, J. D., Calamante, F., Gadian, D. G., & Connelly, A. (2004). Direct estimation of the fiber orientation density function from diffusion-weighted MRI data using spherical deconvolution. Neuroimage, 23(3), 1176-1185.

Description:
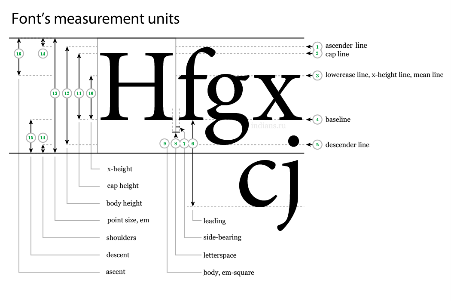
Rendering text in a 3D environment is a crucial component for scientific visualizations, but it also presents several challenges [1, 2]. Proper font spacing and other glyph metrics must be considered to ensure the readability and overall quality of the text [3, 4]. Efficiently rendering large amounts of text requires managing multiple textures and storing many glyphs, which can be challenging.
To overcome these challenges, implementing a dynamic text rendering system in FURY will bring numerous benefits to the scientific visualization community. With support for UTF-8 and FreeType-compatible fonts, users will have access to a wide range of font options, and the use of texture atlases and GPU-based rendering will allow for efficient rendering of large amounts of text. Advanced text features such as justification, baseline alignment, and underlining will further enhance the functionality of the text rendering system. Texture atlas caching is necessary to store and retrieve large numbers of font glyphs efficiently. Another important aspect of text rendering is the proper implementation of font spacing, which ensures even spacing between letters and lines, making text legible.
Using signed distance fields (SDF) [5] and multichannel signed distance fields (MSDF) [6-12] can further enhance the quality of text rendering by providing a smooth and accurate representation of font edges across different scales. The ability to render latex formulas adds another functionality to the text-rendering system, allowing users to include mathematical equations in their visualizations. These advanced techniques are crucial for creating high-quality and professional-looking scientific visualizations in FURY. This project focuses on implementing a dynamic text rendering engine on top of the FURY API that encompasses these features and technologies.
Currently, an existing PR #489 works for monospaced fonts.
Project Steps:
- Step 1: Rebase, test, and finish the existing PR: #489.
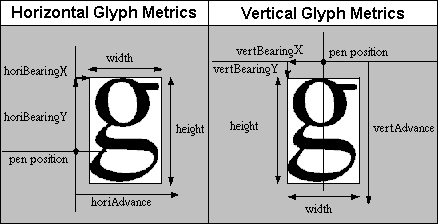
- Step 2: Implement a system to render font glyphs (or a combination of them) to a texture atlas dynamically while also storing glyph metrics, such as the correct kerning as shown in [1]. We recommend using the freetype2 libs (see [3]).
- Step 3: Use multiple textures to cache many glyphs. Options to add, remove, compact, and find space in texture atlases. Also, create new textures as needed.
- Step 4: Render the text using billboards while allowing different options for vertical and horizontal alignment. Use stored glyph metrics to address glyph spacing adequately. See the existing PR.
- Step 5: Add support for signed distance fields (SDF) and multichannel signed distance fields (MSDF) generation via GPU-based distance transform.
- Step 6: Support rendering SDF and MSDF.
- Step 7: Implement other advanced text features, e.g., text justification, baseline alignment, underline, outline, bold, etc.
- Step 8: Latex rendering.
During development, the candidate will produce tests and documentation for the resulting code and API.
Difficulty: Advanced
Project Length: Full-time (350 hours) project
Skills Required: Python, VTK, FURY, and Shading Language knowledge (GLSL)
Mentors: Filipi N. Silva and Bruno Messias
Related References and Links:
- [1] https://learnopengl.com/In-Practice/Text-Rendering.
- [2] https://nehe.gamedev.net/tutorial/freetype_fonts_in_opengl/24001/.
- [3] https://github.com/rougier/freetype-gl.
- [4] https://github.com/nyorem/fontstash.
- [5] Green, C., 2007. Improved alpha-tested magnification for vector textures and special effects. In ACM SIGGRAPH 2007 courses (pp. 9-18). https://dl.acm.org/doi/10.1145/1281500.1281665.
- [6] https://levelup.gitconnected.com/msdf-font-rendering-in-webgl-91ce192d2bec.
- [7] https://github.com/soimy/msdf-bmfont-xml.
- [8] https://medium.com/@calebfaith/implementing-msdf-font-in-opengl-ea09a9ab7e00.
- [9] https://www.youtube.com/watch?v=r-2z-ccuZKE.
- [10] https://github.com/maltaisn/msdf-gdx.
- [11] https://github.com/Chlumsky/msdfgen.
- [12] http://inter-illusion.com/assets/I2SmartEdgeManual/SmartEdge.html?MultiChannelDistanceFields.html.
Description:
In this project, you update scifi-like 3D and 2D user interfaces inspired by Guardians of the Galaxy video. FURY provides many visualization capabilities. However, we were not happy with interactive capabilities found in existing GUIs. For this reason, we built our own UI engine. No Qt! Everything is integrated into the VTK scene. In this project, you will improve this work and add explore new way to handle our widgets. The motto of this project is to make everything interactive without performance issues.
Here are the different steps to achieve:
- Step 1: Get familiar with the library by fixing some issues with some previous UI.
- Step 2: Fix multiple UI Element (comboxbox, tabui, fieldialog, Tree UI...)
- Step 3: Explore a new framework with one existing UI element (to select together)
Difficulty: intermediate
Project Length: Full-time (350 hours) project
Skills required: Python and VTK
Potential Mentors: Serge Koudoro, Eleftherios Garyfallidis