You signed in with another tab or window. Reload to refresh your session.You signed out in another tab or window. Reload to refresh your session.You switched accounts on another tab or window. Reload to refresh your session.Dismiss alert
Before introducing the frequency domain query in IoTDB, I will review the basic knowledge about time-frequency transform.
Time series data consists of a series of data points in the time domain. For example, the data in a time series can be described as (ts_id, {<t, v>}). In IoTDB, ts_id is represented by device_id + sensor_id. Therefore, the data in a time series can be writtern as (d_id, s_id, {<t, v>}).
For example, a simulated time series can be seen in Fig 1.
Fig 1. A time series
As we known, a time series is usually illustrated both in time and frequency domain in the industrial scenario. With a time-frequency transform, the tones will be displayed clearly as a series of sinusoids.
As can be seen in Fig.2,the above time series can be decomposed to 4 curves by FFT algorithm.
Fig 2. The decomposition of the time series
We will obtain the original curve by rotating the 3D figure,shown in Fig.3.
Fig 3. Curves integration
With a given time series, We can get a new series whose X-axis is frequency and Y-axis denotes amplitude. In other words, the amplitude of the time series varies with the frequency. Therefore, the frequency spectrum with 4 spectral lines in Fig.4 can be obtained by FFT on the above time series.
Fig 4. A frequency series
The data in a frequency series can be writtern as (d_id, s_id, {<f, v>}).
Look at Fig 2. once again. If we project the figure from the front of the figure to the behind, we can get a time domain series (i.e., Fig. 3). If we project the figure from the right side to the left side, we can get the frequency domain series (i.e., Fig. 4).
Frequency series is useful for outlier detection and fault diagnosis in industrial applications.
Use case 1: The revolving speed of an automobile engine should be less than 3000r/min (Revolutions per minute). So, for the data (in the frequency domain) whose frequency is greater than 3000/60 Hz is outlier.
Use case 2: If the value of the amplitude is greater than 80, we consider that there is a fault occurred. Then, the user can scan the frequency series to find out the amplitudes of which frequencies are greater than 80.
SQL In IoTDB
Now, IoTDB supports query in the time domain. For example, select s1 from root.d1 where time >2018-10-10T00:00:00 or select s1,s2 from root.d1 where s1> 80.
The query result looks like:
Time
root.d1.s1
root.d1.s2
2018-10-10T00:00:01
90
-
2018-10-10T00:01:00
95
50
2018-10-10T00:01:02
99
-
The first column is the union of the timestamp that the two series have. The 2nd and 3rd column is the value of the two series at the given timestamp.
We consider, let IoTDB supports frequency domain query originally. There are two kinds of query:
Transform data from the time domain to the frequency domain.
Query on the frequency domain.
Transform data from the time domain to the frequency domain
IoTDB still only accepts insertion in the time domain, i.e., insert into root.d1 (time, s1) values (t, v). However, we can transform data into the frequency domain.
Syntax:
SELECT FREQ(<sensor name>) (, FREQ(<sensor name>) )*FROM<series name without sensor> (, <series name without sensor>)* )
(
WHERE<timeClause>
)?
(LIMIT<number>)?
(OFFSET <number>)?
(SLIMIT <number>)?
(SOFFSET <number>)?
Which means transferring the time series into frequency domain and only returning the first <number> ( in the limit clause) frequencies (ordering by the value of frequencies) whose amplitudes are not zero.
If the where clause exists, then the FFT algorithm only is applied on the slice of the time series.
Notice that in the where clause, only time condition is supported. Filters such as s1>80 is meaningless.
OFFSET, SLIMIT, and SOFFSET have the same meaning with queries on the time domain.
The first column is the union of the frequencies that the two series have. The 2nd and 3rd column is the amplitudes of the two series at the given frequencies.
Query on the frequency domain
Syntax:
SELECT FREQ(<sensor name>) (, FREQ(<sensor name>) )*FROM<series name without sensor> (, <series name without sensor>)* )
(
WHERE<conditionClause> ( AND|OR<conditionClause>)*
)?
(LIMIT<number>)?
(OFFSET <number>)?
(SLIMIT <number>)?
(SOFFSET <number>)?
<conditionClause> is similar with the queries on the time domain. The only difference is that the keyword time will be replaced with freq, and use a(sensor name) to represent the amplitude value filter.
Before introducing the frequency domain query in IoTDB, I will review the basic knowledge about time-frequency transform.
Time series data consists of a series of data points in the time domain. For example, the data in a time series can be described as (ts_id, {<t, v>}). In IoTDB, ts_id is represented by device_id + sensor_id. Therefore, the data in a time series can be writtern as (d_id, s_id, {<t, v>}).
For example, a simulated time series can be seen in Fig 1.
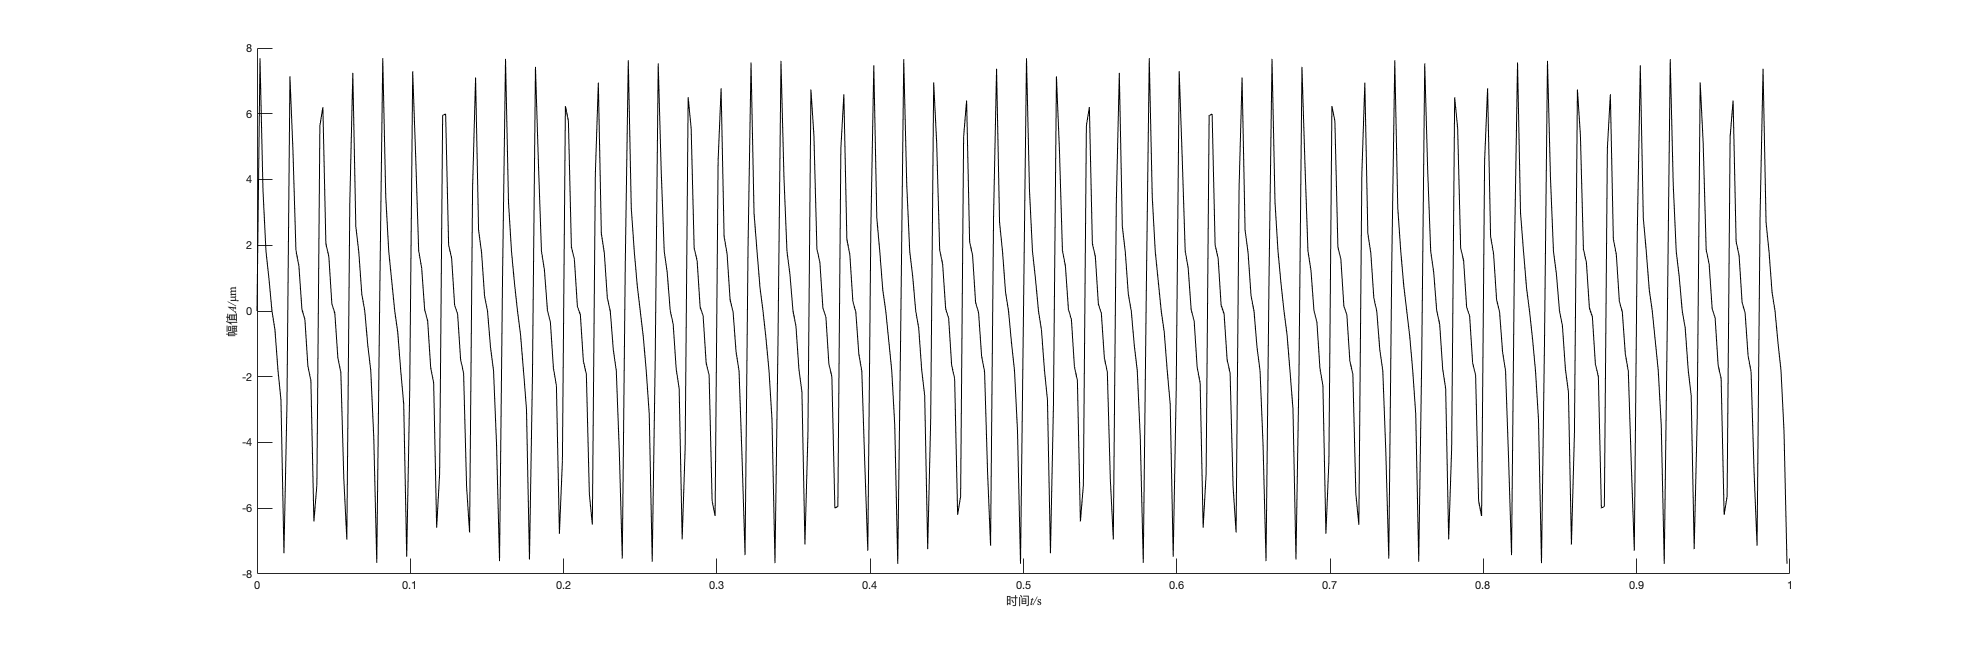
Fig 1. A time seriesAs we known, a time series is usually illustrated both in time and frequency domain in the industrial scenario. With a time-frequency transform, the tones will be displayed clearly as a series of sinusoids.
As can be seen in Fig.2,the above time series can be decomposed to 4 curves by FFT algorithm.
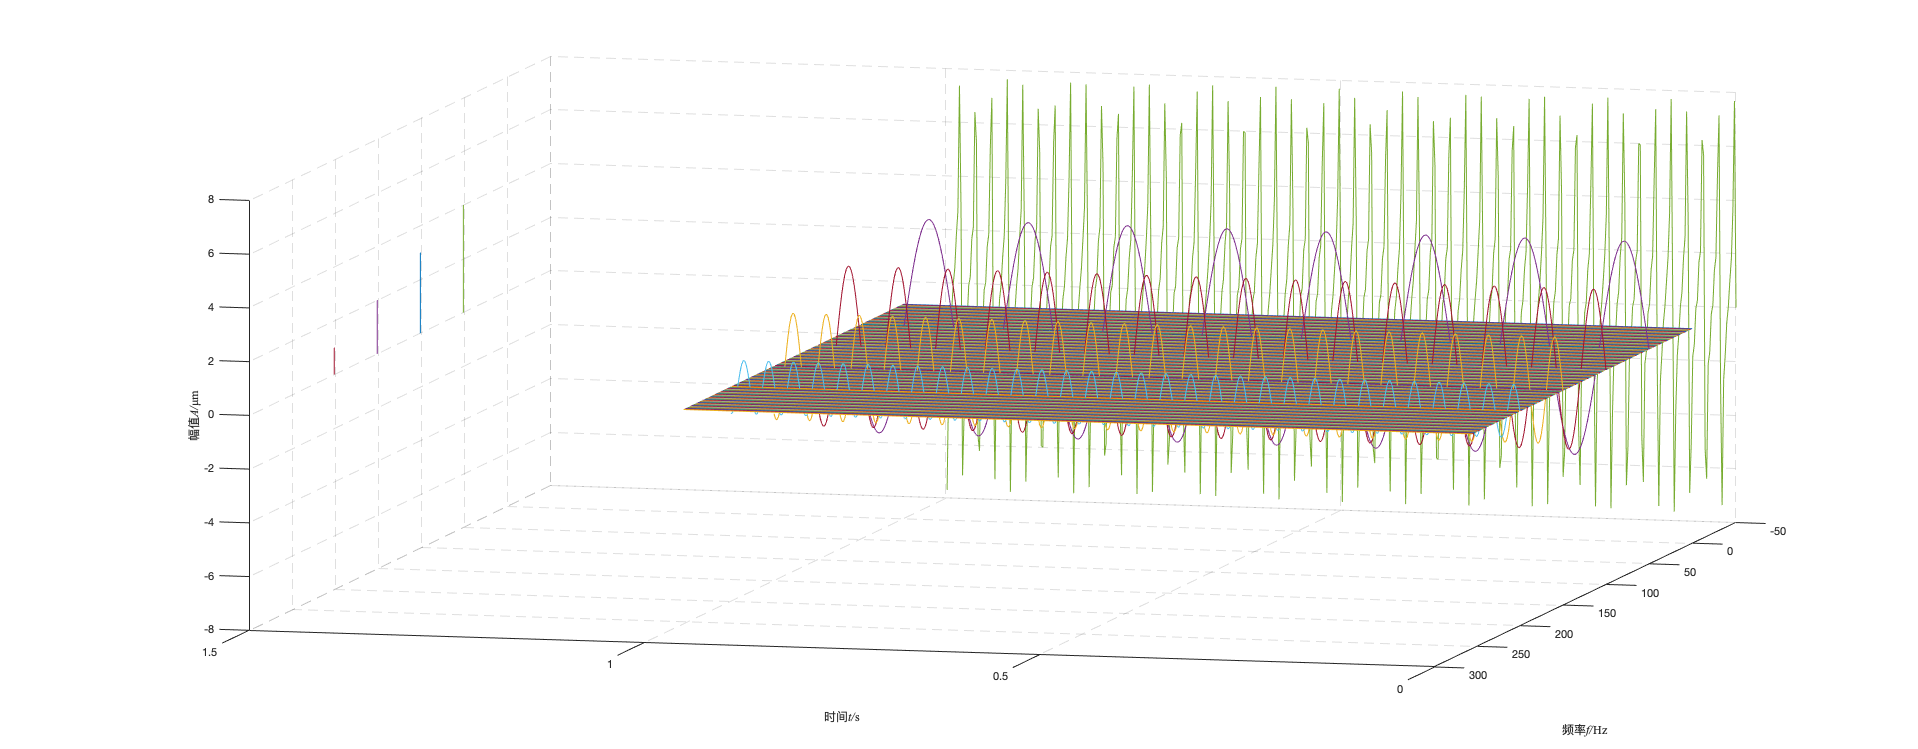
Fig 2. The decomposition of the time seriesWe will obtain the original curve by rotating the 3D figure,shown in Fig.3.
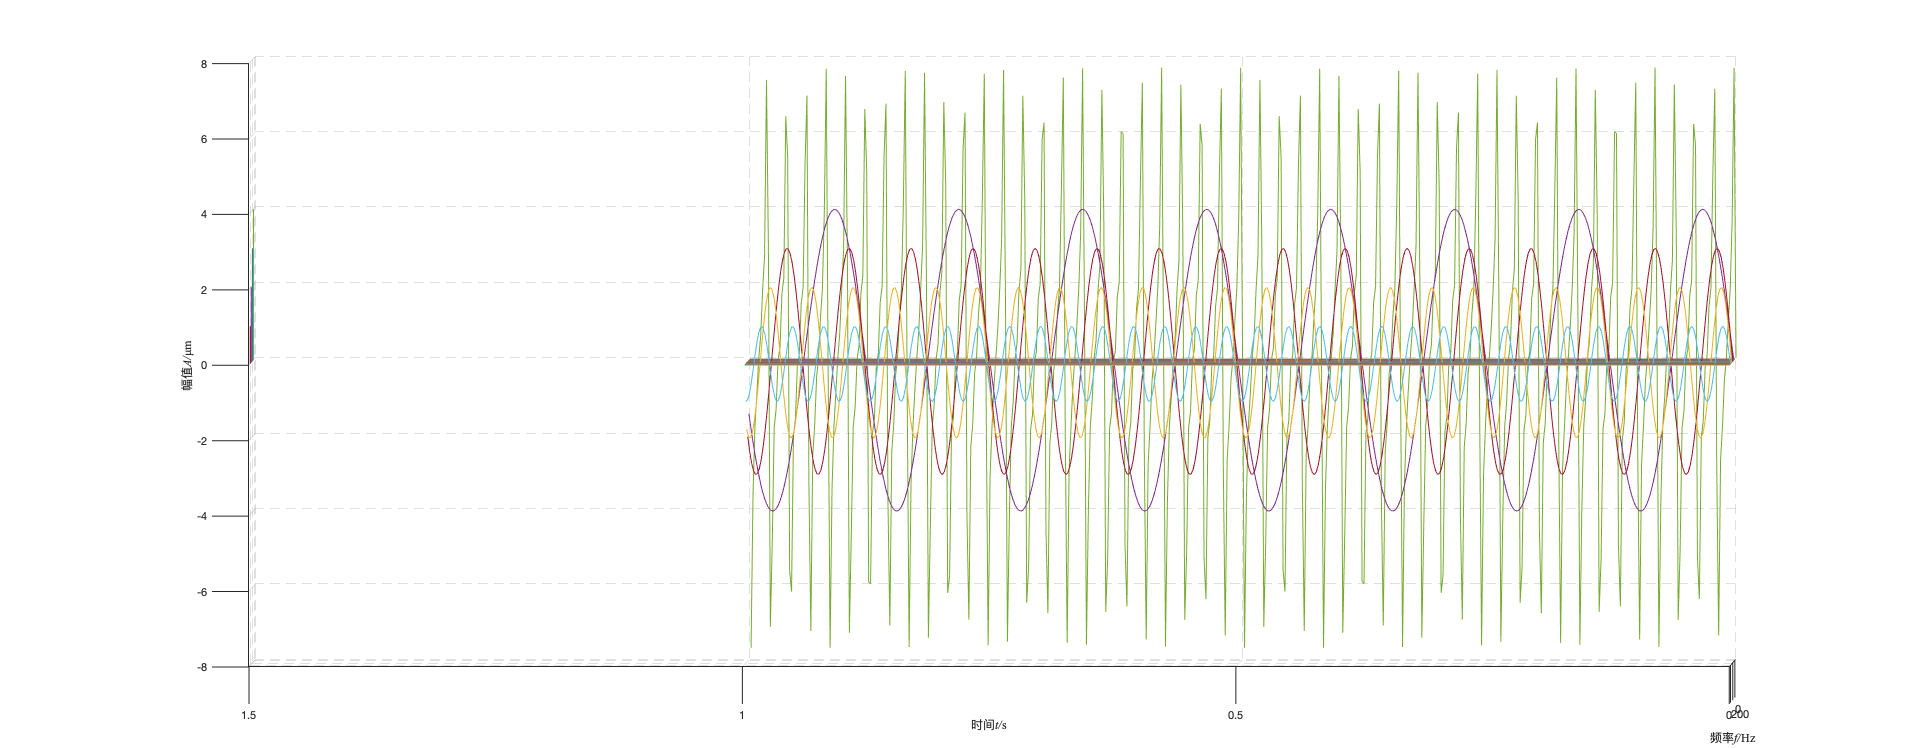
Fig 3. Curves integrationWith a given time series, We can get a new series whose X-axis is frequency and Y-axis denotes amplitude. In other words, the amplitude of the time series varies with the frequency. Therefore, the frequency spectrum with 4 spectral lines in Fig.4 can be obtained by FFT on the above time series.
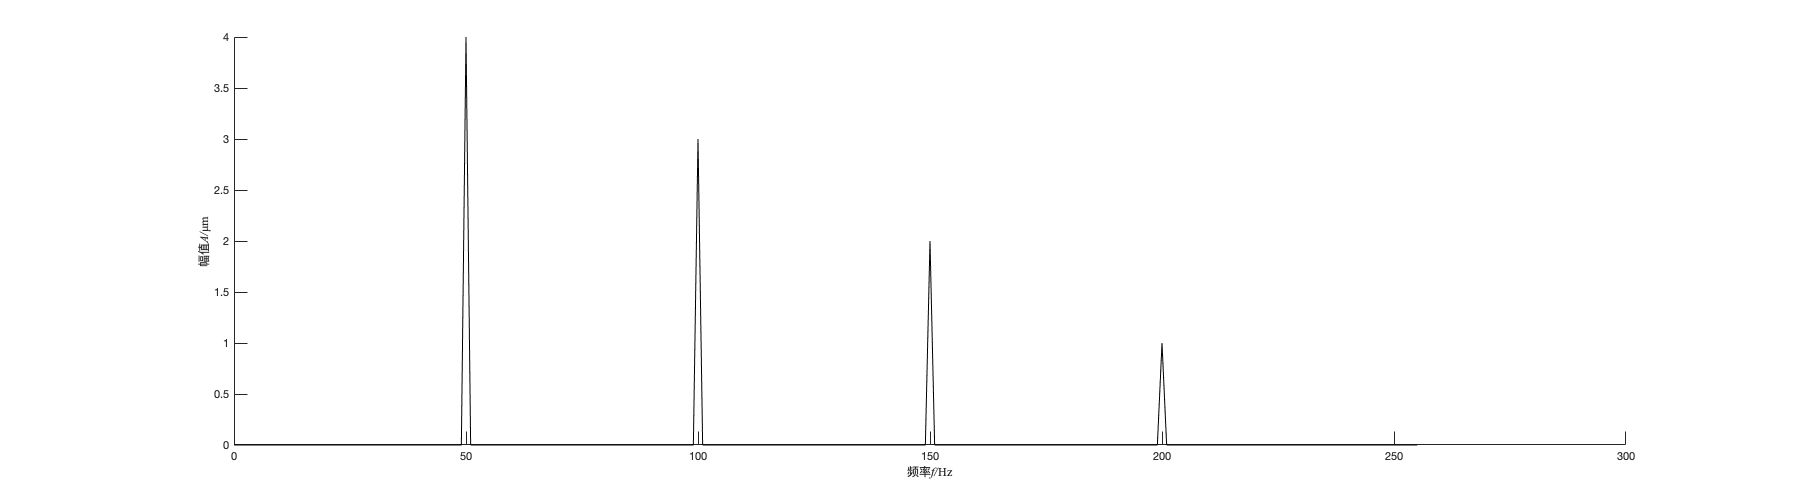
Fig 4. A frequency seriesThe data in a frequency series can be writtern as (d_id, s_id, {<f, v>}).
Look at Fig 2. once again. If we project the figure from the front of the figure to the behind, we can get a time domain series (i.e., Fig. 3). If we project the figure from the right side to the left side, we can get the frequency domain series (i.e., Fig. 4).
Frequency series is useful for outlier detection and fault diagnosis in industrial applications.
Use case 1: The revolving speed of an automobile engine should be less than 3000r/min (Revolutions per minute). So, for the data (in the frequency domain) whose frequency is greater than 3000/60 Hz is outlier.
Use case 2: If the value of the amplitude is greater than 80, we consider that there is a fault occurred. Then, the user can scan the frequency series to find out the amplitudes of which frequencies are greater than 80.
SQL In IoTDB
Now, IoTDB supports query in the time domain. For example,
select s1 from root.d1 where time >2018-10-10T00:00:00orselect s1,s2 from root.d1 where s1> 80.The query result looks like:
The first column is the union of the timestamp that the two series have. The 2nd and 3rd column is the value of the two series at the given timestamp.
We consider, let IoTDB supports frequency domain query originally. There are two kinds of query:
Transform data from the time domain to the frequency domain
IoTDB still only accepts insertion in the time domain, i.e.,
insert into root.d1 (time, s1) values (t, v). However, we can transform data into the frequency domain.Syntax:
Which means transferring the time series into frequency domain and only returning the first <number> ( in the
limitclause) frequencies (ordering by the value of frequencies) whose amplitudes are not zero.If the
whereclause exists, then the FFT algorithm only is applied on the slice of the time series.Notice that in the where clause, only time condition is supported. Filters such as
s1>80is meaningless.OFFSET,SLIMIT, andSOFFSEThave the same meaning with queries on the time domain.Example:
Output:
The first column is the union of the frequencies that the two series have. The 2nd and 3rd column is the amplitudes of the two series at the given frequencies.
Query on the frequency domain
Syntax:
<conditionClause> is similar with the queries on the time domain. The only difference is that the keyword
timewill be replaced withfreq, and usea(sensor name)to represent the amplitude value filter.Example:
Output:
The text was updated successfully, but these errors were encountered: