Usage:
./ProvMark bg <Tools> <Tools Base Directory> <Benchmark Program Directory> [<Trial> <Round>]
Example for generating benchmark for syscall create using SPADE with Graphviz storage:
./ProvMark bg spg /home/vagrant/SPADE ./benchmarkProgram/baseSyscall/grpCreat/cmdCreat 2 1
Example for CamFlow (note that the "tool base directory" is unused and arbitrary in this case):
./ProvMark bg cam . ./benchmarkProgram/baseSyscall/grpCreat/cmdCreat 2 1
- spg: SPADE with Graphviz storage
- spn: SPADE with Neo4j storage
- opu: OPUS
- cam: CamFlow
- Base directory of the chosen tool, it is assumed that if you want to execute this benchmarking system on certain provenance collecting tools, you should have installed that tools with all dependencies required by the tools. If you build ProvMark with the given Vagrant script, the default tools base directory is shown as follows; ignored for CamFlow
- SPADE: /home/vagrant/SPADE
- OPUS: You should have installed OPUS manually
- CamFlow: ./
- Base directory of the benchmark program
- Point the script to the syscall choice for the benchmarking process
- Number of trials executed for each graph for generalization
- More trials will result in longer processing time, but provide a more accurate result as multiple trial can help to filter out uncertainty and unrelated elements and noise
- For scalibility test only.
- Declare how much time the same content is running repeataly
- Three clingo graphs stored in result folder
- general.clingo-program-[MD5Hash]: generalized foreground graph
- general.clingo-control-[MD5Hash]: generalized background graph
- result-[MD5Hash].clingo: final benchmark graph
- Remark: The MD5Hash indicating the fingerprint for this graph or benchmark. For deterministic input, there will only be one set of result. For non-deterministic input, there will be multiple set of result indicating different possible branches. The result of each branches will bear a different MD5Hash fingerprint
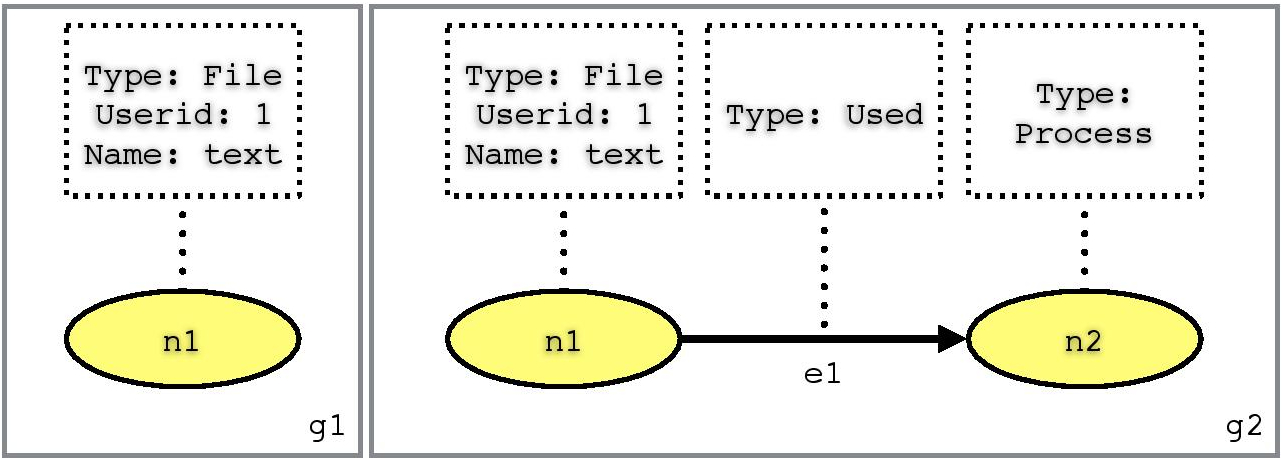
- Node
n<graph identifier>(<node identifier>,<type>)
- Edge (Directed edge)
e<graph identifier>(<edge identifier>, <start node identifier>, <end node identifier>, <type>)
- Properties
l<graph identifier>(<node / edge identifier>, <key>, <value>)
Usage:
./genClingoGraph/clingo2Dot.py <Clingo Graph> <Output Graph>
Example:
./genClingoGraph/clingo2Dot.py result/result.clingo result/result.dot
The command shown above is used to transfer clingo graph into DOT format. DOT is a graph description language. The default tool of DOT visualization is Graphviz DOT tool, which is shown as follows:
Usage:
dot -T<Graph Type> -o <Output File> <DOT graph>
Example for visualizing DOT graph as pdf format:
dot -Tpdf -o result/result.pdf result/result.dot
Example for visualizing DOT graph as svg format:
dot -Tsvg -o result/result.pdf result/result.dot
ng1(n1,"File").
pg1(n1,"Userid","1").
pg1(n1,"Name","text").

ng2(n1,"File").
ng2(n2,"Process").
pg2(n1,"Userid","1").
eg2(e1,n1,n2,"Used").
pg2(n1,"Name","text").
Automatically execute ProvMark for all syscall currently supported. The runTests script will search for all benchmark programs recursively in the default benchmarkProgarm folder and benchmark them one by one. It will also group the final result and post process them according to the given result type paramemter.
Usage:
./runTests <Tools> <Tools_Path> <Result Type> [<Trial> <Target Base Path>]
- Number of trial executed for each graph for generalization
- More trial will result in longer processing time, but provide a more accurate result as multiple trial can help to filter out uncertainty and unrelated elements and noise
- Path to the location of the directory storing the target testing command group, with separate syscall folder inside containing prepare script for the specific syscall.
Example for batch execution of spade with Graphviz storage and generate html webpage to display all result
./runTests spg /home/vagrant/SPADE rh
Example for batch execution of CamFlow (again, the base directory is ignored in this case):
./runTests cam . rh 11 expSyscall
- spg: SPADE with Graphviz storage
- spn: SPADE with Neo4j storage
- opu: OPUS
- cam: CamFlow
- Base directory of the chosen tool, it is assumed that if you want to execute this benchmarking system with a specific provenance collecting tool; ignored if tools are globally accessible
- rb: benchmark only
- rg: benchmark and generalized foreground and background graph only
- rh: html page displaying benchmark and generalized foreground and background graph
- Result stored in finalResult directory
- Each syscall has a subdirectory under finalResult directory
- Graph in svg format
- Benchmark graph stored in each syscall subdirectory separately
- Generalized foreground and background graph stored in each syscall subdirectory separately (rg and rh only)
- An index.html file stored in finalResult directory to display all graph in html table (rh only)
For the generation of the sample output, we have used the provided Vagrant script to build up the environment for the three provenance systems and execute a batch execution in each of the built virtual machine. The following command is used in each virtual machine respectively.
./runTests spg /home/vagrant/SPADE rh
./runTests opu /home/vagrant/opus rh
./runTests cam . rh 11
The full result of the batch execution will be stored in finalResult directory located under the current directory. If you choose the rh options, there is also a index webpage generated. You can view the thumbnails of all the provenance benchmark by opening finalResult/index.html in a browser, each of the thumbnails are clickable and will display the full size provenance benchmark when clicked. If you choose other options, you may need to manually open the provenance benchmark image in the finalResult directory which is classified by system calls.
Usage:
./ProvMark bt <Tools> <Tools Base Directory> <Testing Program> -f <Benchmark File>
./ProvMark bt <Tools> <Tools Base Directory> <Testing Program> -d <Benchmark Directory>
Example for evaluating single benchmark generating using SPADE with Graphviz storage on testing program target:
./ProvMark bt spg /path/to/spade/base/directory /path/to/program/target -f /path/to/benchmark
Example for evaluating multiple benchmark generating using CamFlow on testing program target (note that the "tool base directory" is unused and arbitrary in this case):
./ProvMark bt cam . /path/to/program/target -d /path/to/directory/contains/all/benchmark
- spg: SPADE with Graphviz storage
- spn: SPADE with Neo4j storage
- opu: OPUS
- cam: CamFlow
- Base directory of the chosen tool, it is assumed that if you want to execute this benchmarking system on certain provenance collecting tools, you should have installed that tools with all dependencies required by the tools; ignored if tools are globally accessible
- An executable used for evaluation
- ProvMark will check if the patterns determine by the given benchmark files exists in this program
- Path to the single benchmark file for evaluation
- Path to the directory containing mutliple benchmark files for evaluation
- Three line of output
Sample output when benchmark patterns exist in the testing program
Minimum Edit Distance between all benchmark patterns and the testing program provenance graph: 12
Threshold set: 100
Conclusion: syscall action sequence represent by benchmark patterns does exist in the testing program
Sample output when benchmark patterns not exist in the testing program
Minimum Edit Distance between all benchmark patterns and the testing program provenance graph: 112
Threshold set: 100
Conclusion: syscall action sequence represent by benchmark patterns does not exist in the testing program
The full result of the batch execution will be stored in finalResult directory located under the current directory. If you choose the rh options, there is also a index webpage generated. You can view the thumbnails of all the provenance benchmark by opening finalResult/index.html in a browser, each of the thumbnails are clickable and will display the full size provenance benchmark when clicked. If you choose other options, you may need to manually open the provenance benchmark image in the finalResult directory which is classified by system calls.