Home
Update: 2014/04/16
Video introduction to JITWatch
https://skillsmatter.com/skillscasts/5243-chris-newland-hotspot-profiling-with-jit-watch
Slides from my LJC lightning talk on JITWatch:
http://www.chrisnewland.com/images/jitwatch/HotSpot_Profiling_Using_JITWatch.pdf
A tool for understanding the behaviour of the Java HotSpot Just-In-Time (JIT) compiler during the execution of your program.
Works by processing the hotspot.log file output by the JVM.
I built this tool as a learning vehicle to gain a better understanding of HotSpot and JavaFX.
For usage questions, bug reports, feature requests, and general chat about JIT, HotSpot, JVM, bytecode and performance tuning please join the list at https://groups.google.com/forum/#!forum/jitwatch
- To verify whether methods you believe to be performance-critical were JIT-compiled during the program's execution.
- To learn when your performance-critical methods were compiled.
- For visualising the effects of tuning JVM compilation thresholds.
- To gain a better understanding of the HotSpot JIT compiler.
- To have a nice interface for inspecting method bytecode and assembly?
- Browse class trees and view which methods were JIT-compiled, when JIT-compilation occurred, and information about the compilation.
- Mount your source, jars, and class trees to jump to the source, bytecode, and assembly for a method.
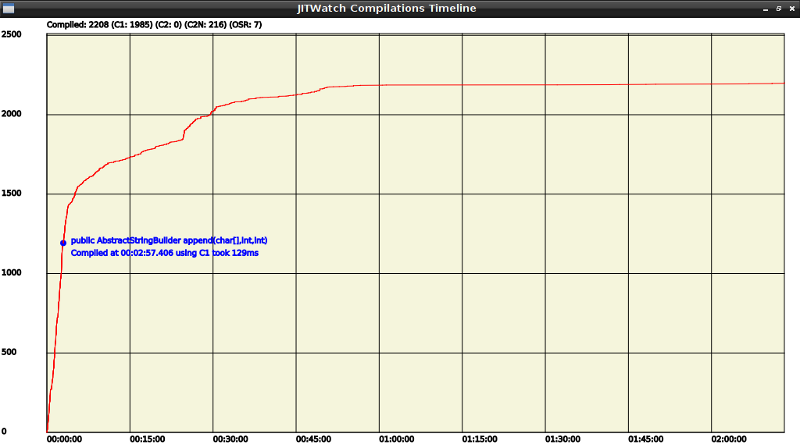
- Plot JIT compilations over time and visualise when a method was JIT-compiled.
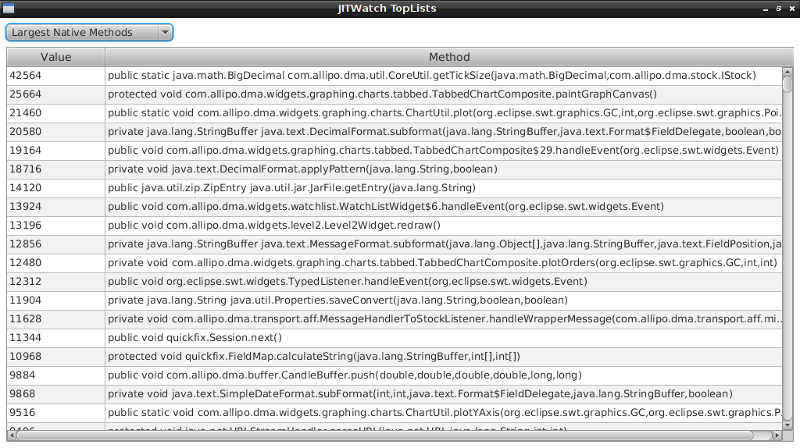
- View toplists of the largest native methods, methods with most bytecodes, longest compilation times, etc.
- Open sourced under the Simplified BSD licence.
Pre-built jars are now produced by Jenkins CI. See the README for details
To generate the hotspot.log file used by JITWatch run your program with the following JVM switches.
-XX:+UnlockDiagnosticVMOptions -XX:+TraceClassLoading -XX:+LogCompilation -XX:+PrintAssembly
The hotspot.log file is generated in the program execution directory.
If you want to use the -XX:+PrintAssembly switch to view the assembly language (disassembled JIT-compiled native code) then you need to use a debug JVM build or have built the hsdis (HotSpot disassembler) binary. The source for hsdis is part of OpenJDK.
Instructions for building hsdis (for Windows) are here: Building hsdis on Windows
Instructions for building hsdis (for Linux) are here: [Building hsdis on Linux] (http://www.chrisnewland.com/building-hsdis-on-linux-amd64-on-debian-369)
-XX:+TraceClassLoading is used to ensure that classes with no JIT-compiled methods still appear in the class tree. It is safe to exclude this VM option if you don't need to see them.
JavaFX (JAVA_HOME/jre/lib/jfxrt.jar) and tools.jar (JDK_HOME/lib/tools.jar) are required to run JITWatch.
Example launch script (Linux):
#!/bin/sh
export CP=$JDK_HOME/lib/tools.jar:$JDK_HOME/jre/lib/jfxrt.jar:jitwatch.jar
$JDK_HOME/bin/java -cp $CP com.chrisnewland.jitwatch.launch.LaunchUI
Please report it using the Issue Tracker
Thanks to Martijn Verburg for maven help and lots of useful suggestions!
Thanks to Dr Heinz Kabutz and the participants of JCrete 2013 for an amazing unconference and inspiring me to up my Java game.
The idea for building this tool came after reading The Well Grounded Java Developer by Ben Evans and Martijn Verburg.
Oracle HotSpot Internals wiki LogCompilation
Oracle HotSpot Internals wiki PrintAssembly
My "Understanding HotSpot Logs" session at the JCrete (un)conference (Open Spaces)
Slides on Understanding HotSpot Logs
Love it? Hate it? Want a new feature? Let me know!
Twitter: @chriswhocodes
Email : chris@chrisnewland.com
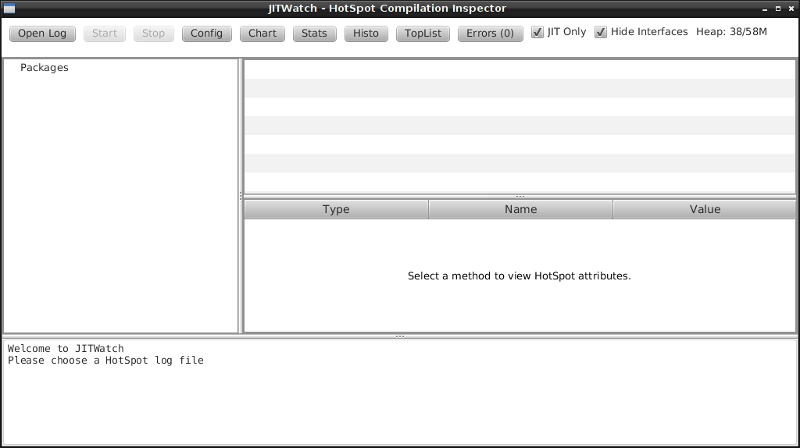
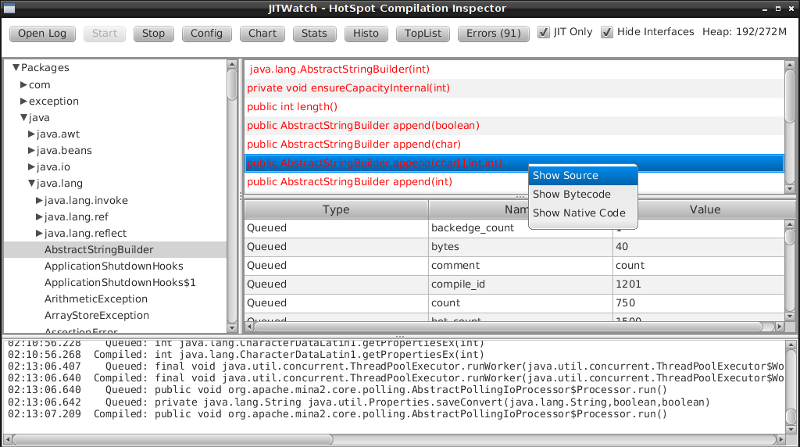
Main JITWatch application window.
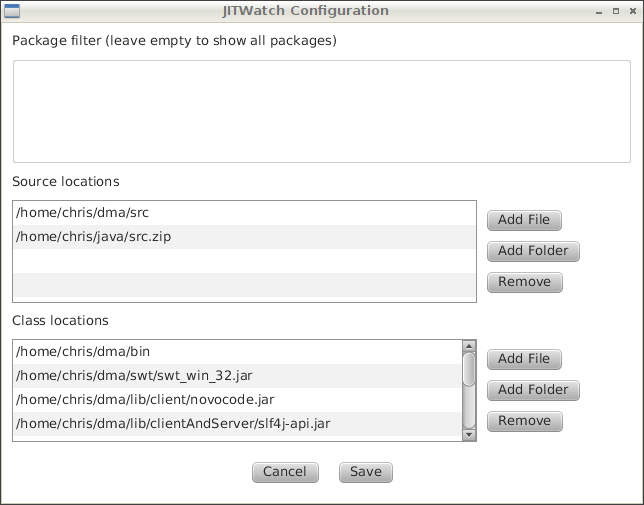
Configure JITWatch by mounting src trees, class folders, and jars.
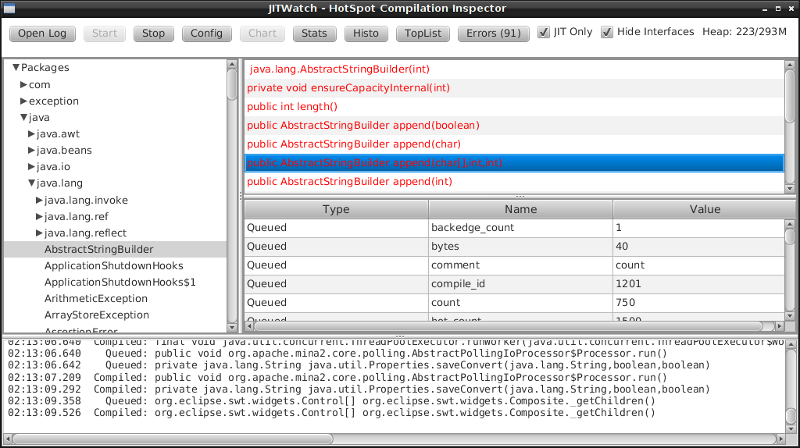
Browse the package tree and inspect methods.
Right click a method to show source, bytecode, and assembly.
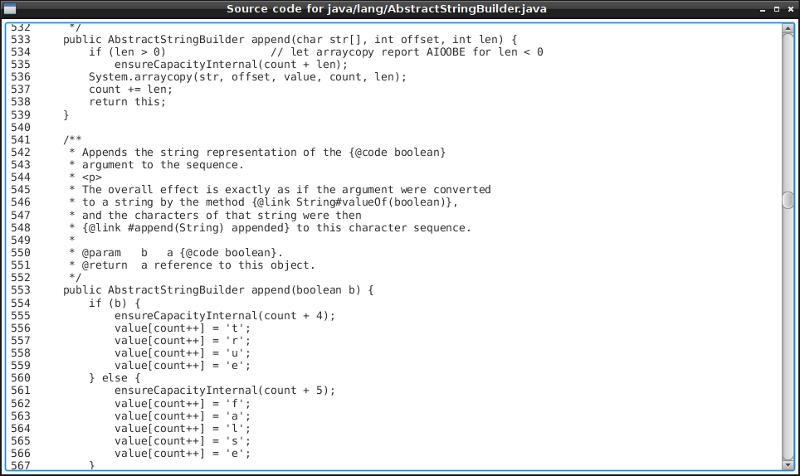
View source code of method.
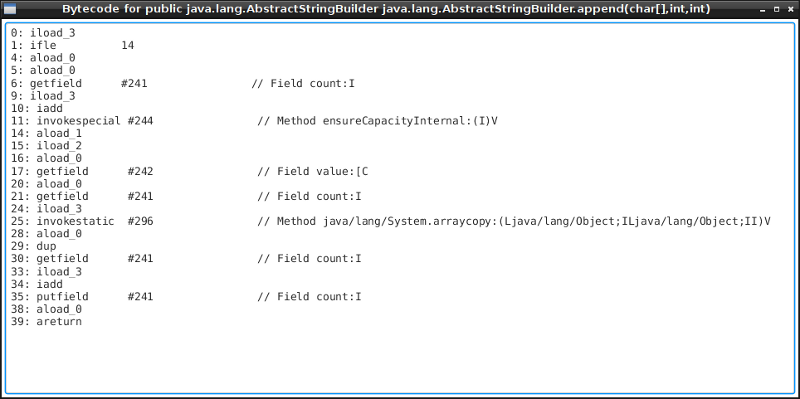
View bytecode of method.
View the assembly language for the method.
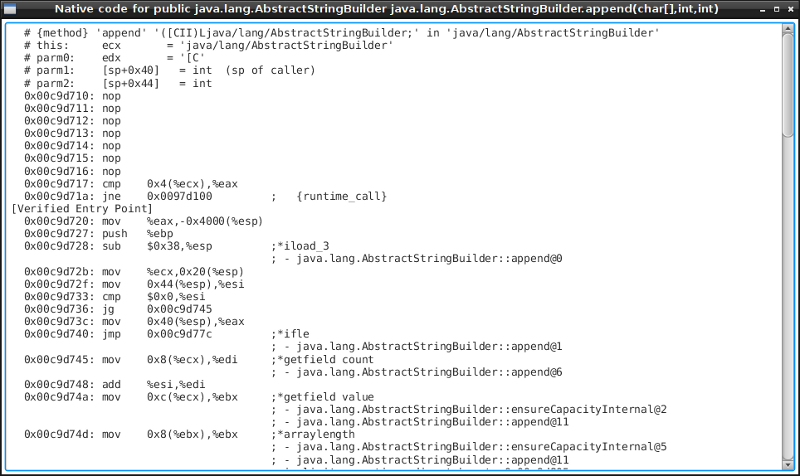
Chart of compilations over time. Selected method is shown.
Toplists of largest native methods, highest bytecode count, longest compile time, etc.
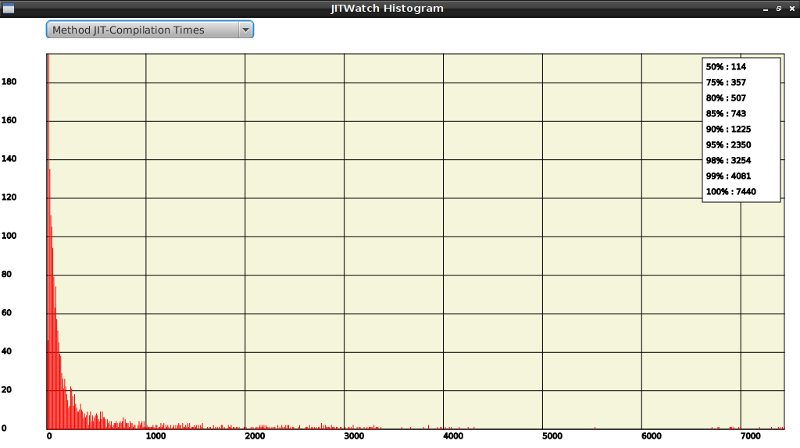
Histograms of compile times, method sizes, etc.
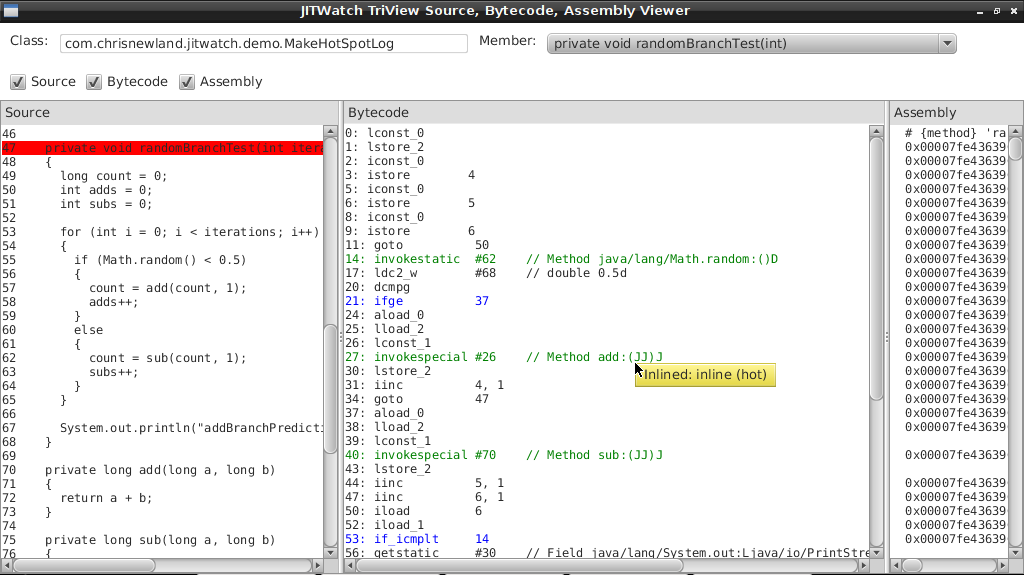
TriView combined source, bytecode, assembly viewer.
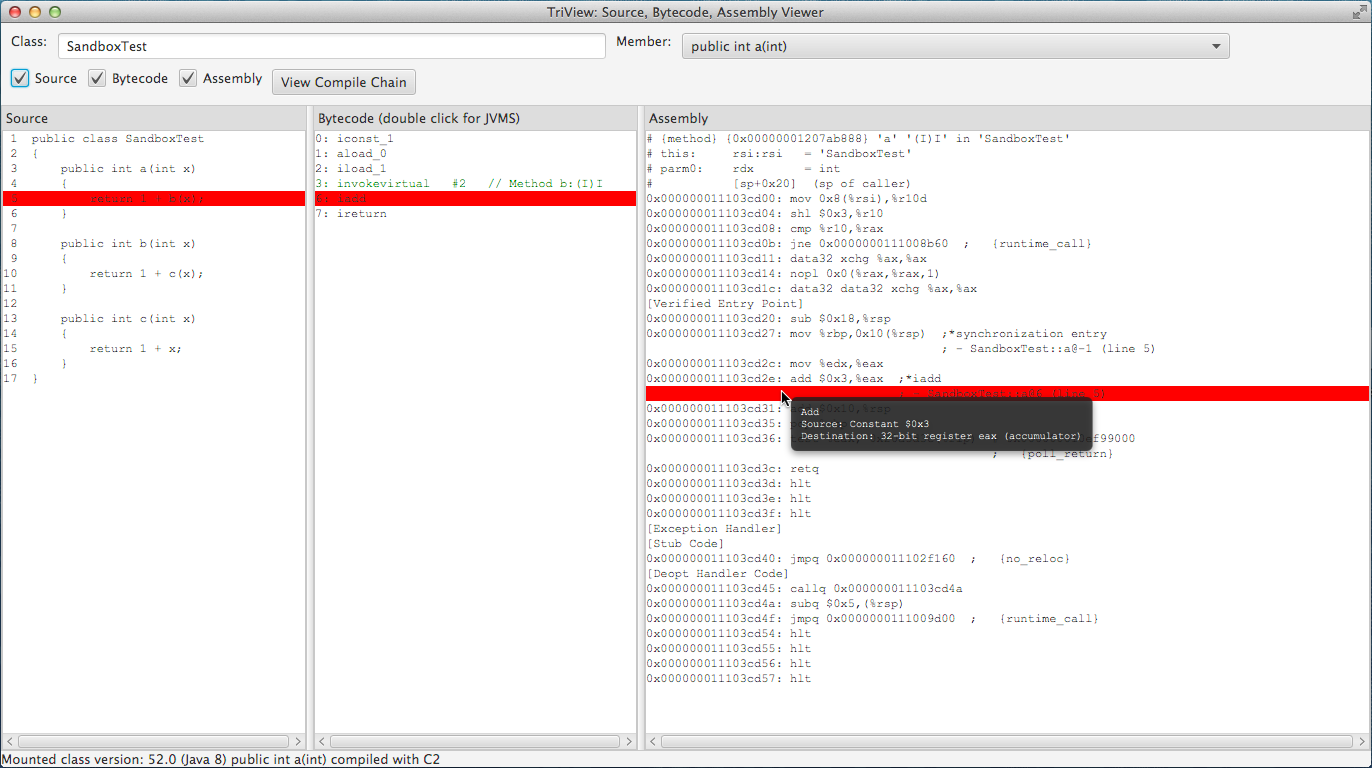
Bytecode annotations for inlining and branch taken probability.
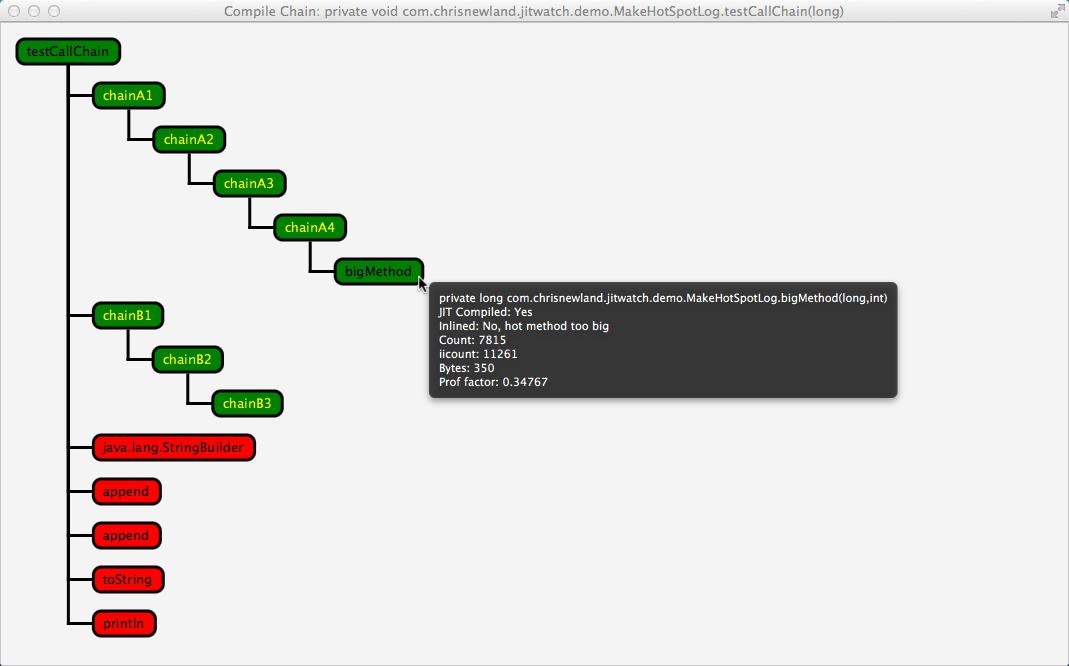
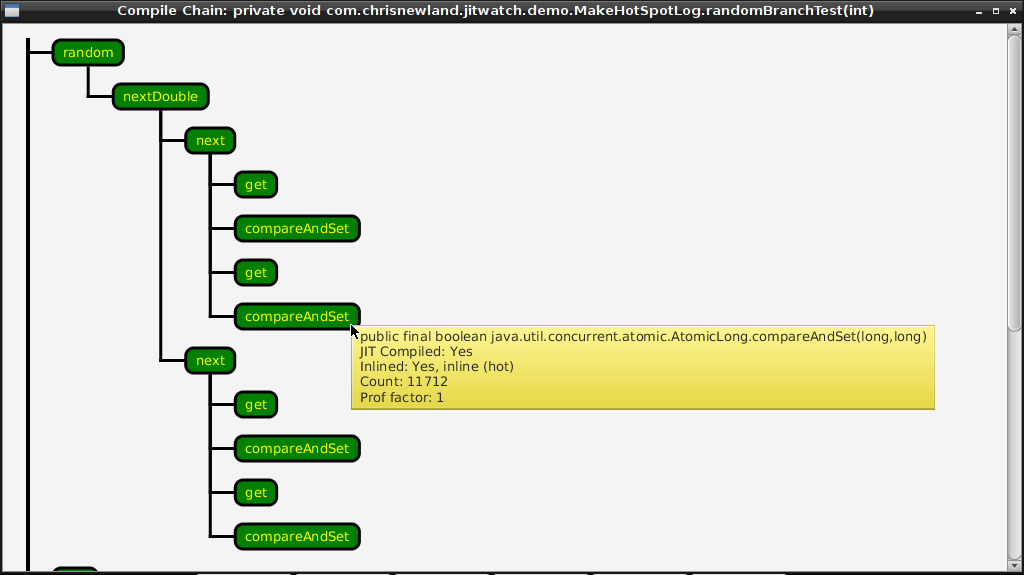
Compile Chain showing JIT-compiled and inlined members.
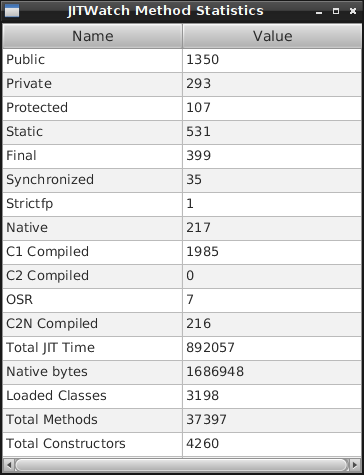
Statistics on JIT compilations made by HotSpot.